Multiple Choice
Figure 4-10 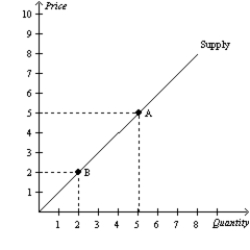
-Refer to Figure 4-10.The movement from Point A to Point B represents a(n)
A) increase in the price.
B) decrease in the quantity supplied.
C) shift in the supply curve.
D) Both a and b are correct.
Correct Answer:

Verified
Correct Answer:
Verified
Q45: Figure 4-12<br><img src="https://d2lvgg3v3hfg70.cloudfront.net/TB2297/.jpg" alt="Figure 4-12
Q46: The following table contains a supply schedule
Q47: A leftward shift of a supply curve
Q47: Suppose there are six bait and tackle
Q49: Figure 4-14 <img src="https://d2lvgg3v3hfg70.cloudfront.net/TB2297/.jpg" alt="Figure 4-14
Q51: A CPA recently has come to expect
Q52: Holding the nonprice determinants of supply constant,a
Q53: Which of the following would shift the
Q54: The law of supply states that,other things
Q89: A improvement in production technology will shift