Multiple Choice
Figure 4-11 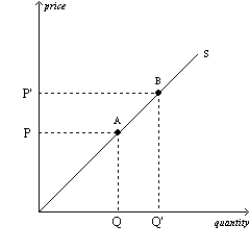
-Refer to Figure 4-11.The movement from point A to point B on the graph is called
A) a decrease in supply.
B) an increase in supply.
C) an increase in the quantity supplied.
D) a decrease in the quantity supplied.
Correct Answer:

Verified
Correct Answer:
Verified
Related Questions
Q67: A decrease in quantity supplied<br>A)results in a
Q68: A market supply curve shows how the
Q69: If sellers expect higher basket prices in
Q70: Wheat is the main input in the
Q71: A market supply curve shows<br>A)the total quantity
Q73: If car manufacturers begin using new labor-saving
Q74: Which of the following is a determinant
Q75: Which of the following demonstrates the law
Q76: The difference between a supply schedule and
Q77: When quantity supplied decreases at every possible