Multiple Choice
Figure 4-7 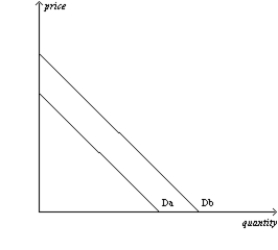
-Refer to Figure 4-7.The shift from Db to Da is called
A) an increase in demand.
B) a decrease in demand.
C) a decrease in quantity demanded.
D) an increase in quantity demanded.
Correct Answer:

Verified
Correct Answer:
Verified
Q77: A decrease in demand is represented by
Q78: Figure 4-7 <img src="https://d2lvgg3v3hfg70.cloudfront.net/TB2297/.jpg" alt="Figure 4-7
Q79: If a good is inferior,then an increase
Q80: For the general population,a 10 percent increase
Q81: If buyers today become more willing and
Q83: If toast and butter are complements,then which
Q84: When drawing a demand curve,<br>A)demand is measured
Q85: Which of the following events could shift
Q86: Which of the following does not affect
Q87: Figure 4-5 <img src="https://d2lvgg3v3hfg70.cloudfront.net/TB2297/.jpg" alt="Figure 4-5