Multiple Choice
Figure 4-7 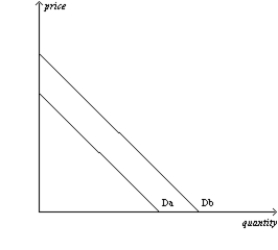
-Refer to Figure 4-7.If the demand curve for Good X shifts from Db to Da,then
A) firms would be willing to supply more of Good X than before at each possible price.
B) people are willing to buy less of Good X than before at each possible price.
C) people's incomes must have increased.
D) the price of Good X has increased.
Correct Answer:

Verified
Correct Answer:
Verified
Q38: Figure 4-8 <img src="https://d2lvgg3v3hfg70.cloudfront.net/TB2297/.jpg" alt="Figure 4-8
Q39: An increase in quantity demanded<br>A)results in a
Q40: Figure 4-4<br><img src="https://d2lvgg3v3hfg70.cloudfront.net/TB2297/.jpg" alt="Figure 4-4
Q41: A decrease in the price of a
Q42: For teenagers,a 10 percent increase in the
Q44: You watch a lot of HGTV during
Q45: A market demand curve shows how the
Q46: If a good is normal,then an increase
Q47: The market demand curve<br>A)is found by vertically
Q48: Figure 4-3<br><img src="https://d2lvgg3v3hfg70.cloudfront.net/TB2297/.jpg" alt="Figure 4-3