Multiple Choice
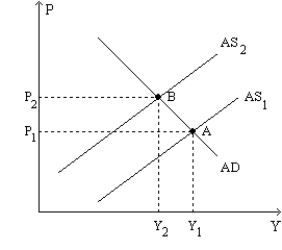
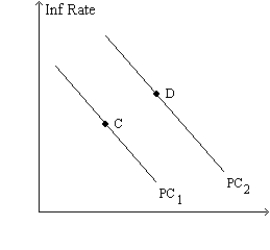
Figure 35-9.The left-hand graph shows a short-run aggregate-supply (SRAS) curve and two aggregate-demand (AD) curves.On the right-hand diagram,"Inf Rate" means "Inflation Rate." 

-Refer to Figure 35-9.The shift of the aggregate-supply curve from AS1 to AS2
A) results in a more favorable trade-off between inflation and unemployment.
B) results in a more favorable trade-off between inflation and the growth rate of real GDP.
C) represents an adverse shock to aggregate supply.
D) represents a favorable shock to aggregate supply.
Correct Answer:

Verified
Correct Answer:
Verified
Q50: In which case,if any,will inflation remain higher
Q51: A favorable supply shock will shift short-run
Q52: An event that directly affects firms' costs
Q53: If policymakers accommodate an adverse supply shock,then
Q54: A favorable supply shock<br>A)raises unemployment and the
Q57: If there is a temporary adverse supply
Q59: In 1980,the U.S.economy had an inflation rate
Q60: Which of the following results in higher
Q122: Suppose OPEC is unable to come to
Q185: If the Fed wants to reverse the