Multiple Choice
Figure 35-6
Use the graph below to answer the following questions. 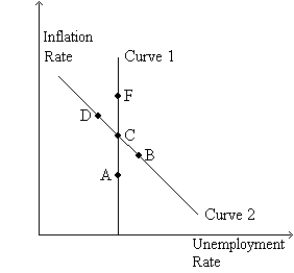
-Refer to Figure 35-6.Curve 2 is the
A) long-run Phillips curve.
B) short-run Phillips curve.
C) long-run aggregate demand curve.
D) short-run aggregate demand curve.
Correct Answer:

Verified
Correct Answer:
Verified
Q23: A politician blames the Federal Reserve for
Q28: In the long run, a decrease in
Q147: On a given short-run Phillips curve which
Q149: A policy intended to reduce unemployment by
Q150: Figure 35-7<br>Use the two graphs in the
Q153: If inflation expectations decline,then the short-run Phillips
Q156: By about 1973,U.S.policymakers had learned that<br>A)Friedman and
Q157: Suppose the central bank increases the growth
Q174: A vertical long-run Phillips curve is consistent
Q193: According to the Phillips curve, unemployment and