Multiple Choice
Figure 35-6
Use the graph below to answer the following questions. 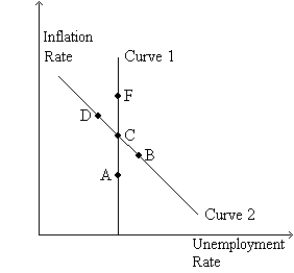
-Refer to Figure 35-6.The money supply growth rate is greatest at
A) A.
B) B.
C) C.
D) F.
Correct Answer:

Verified
Correct Answer:
Verified
Related Questions
Q23: A politician blames the Federal Reserve for
Q28: In the long run, a decrease in
Q141: In the long run,if there is an
Q142: Suppose the Federal Reserve makes monetary policy
Q144: Suppose that the central bank unexpectedly increases
Q145: Any policy change that reduced the natural
Q147: On a given short-run Phillips curve which
Q149: A policy intended to reduce unemployment by
Q150: Figure 35-7<br>Use the two graphs in the
Q192: Milton Friedman argued that the Fed's control