Multiple Choice
Figure 35-7
Use the two graphs in the diagram to answer the following questions. 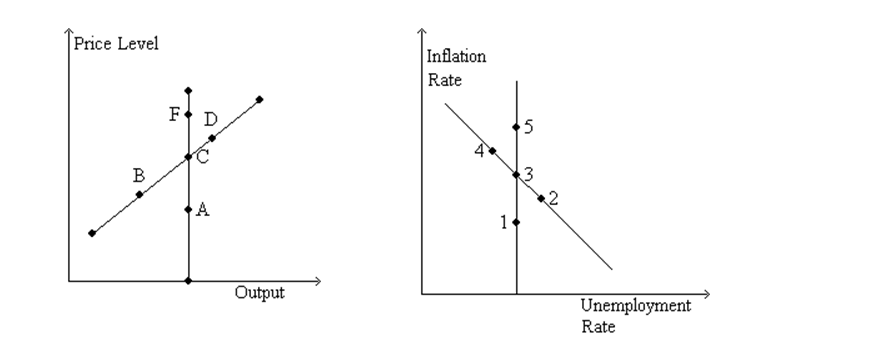
-Refer to Figure 35-7.Starting from C and 3,in the short run an unexpected increase in money supply growth moves the economy to
A) A and 1.
B) B and 2.
C) back to C and 3.
D) D and 4.
Correct Answer:

Verified
Correct Answer:
Verified
Q54: Friedman and Phelps argued<br>A)that in the long
Q55: Which of the following is downward-sloping?<br>A)both the
Q57: Figure 35-8<br>Use this graph to answer the
Q58: If the economy is at the point
Q60: An increase in expected inflation shifts<br>A)the long-run
Q61: In the long run,which of the following
Q62: For many years country A has had
Q63: Natural rate of unemployment - a ×
Q64: Figure 35-7<br>Use the two graphs in the
Q178: If the minimum wage increased, then at