Multiple Choice
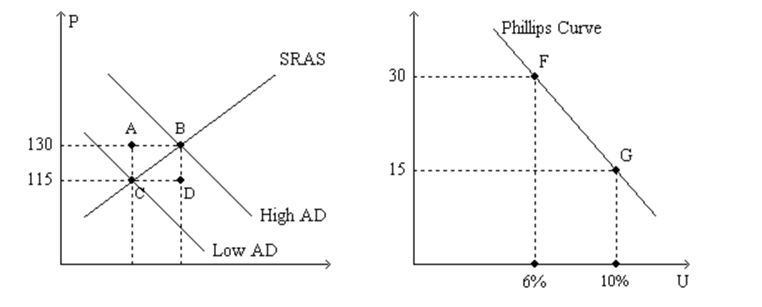
Figure 35-1.The left-hand graph shows a short-run aggregate-supply (SRAS) curve and two aggregate-demand (AD) curves.On the right-hand diagram,U represents the unemployment rate. 
-Refer to Figure 35-1.The curve that is depicted on the right-hand graph offers policymakers a "menu" of combinations
A) that applies both in the short run and in the long run.
B) that is relevant to choices involving fiscal policy,but not to choices involving monetary policy.
C) of inflation and unemployment.
D) All of the above are correct.
Correct Answer:

Verified
Correct Answer:
Verified
Q12: During the financial crisis Congress and President
Q13: Figure 35-2<br>Use the pair of diagrams below
Q14: According to the short-run Phillips curve,inflation<br>A)and unemployment
Q15: Samuelson and Solow argued that when unemployment
Q16: Samuelson and Solow believed that the Phillips
Q18: According to the Phillips curve,policymakers can reduce
Q19: If consumer confidence rises,then aggregate demand shifts<br>A)right,making
Q20: Economist A.W.Phillips found a negative correlation between<br>A)output
Q21: As the aggregate demand curve shifts leftward
Q22: Figure 35-2<br>Use the pair of diagrams below