Multiple Choice
Figure 34-6.On the left-hand graph,MS represents the supply of money and MD represents the demand for money;on the right-hand graph,AD represents aggregate demand.The usual quantities are measured along the axes of both graphs. 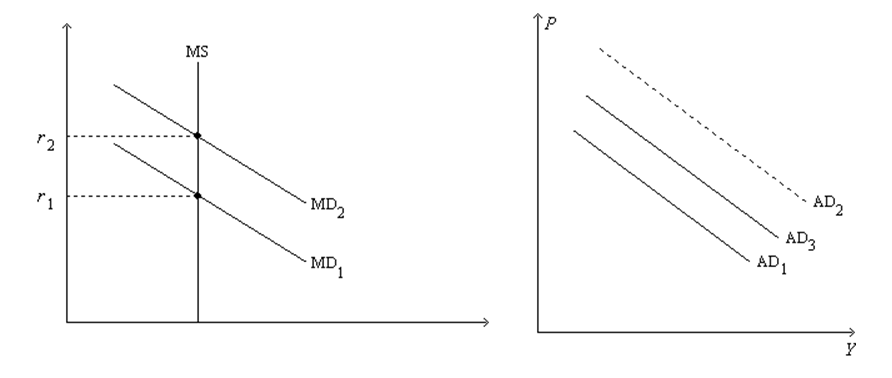
-Refer to Figure 34-6.Suppose the multiplier is 3 and the government increases its purchases by $25 billion.Also,suppose the AD curve would shift from AD1 to AD2 if there were no crowding out;the AD curve actually shifts from AD1 to AD3 with crowding out.Finally,assume the horizontal distance between the curves AD1 and AD3 is $40 billion.The extent of crowding out,for any particular level of the price level,is
A) $15 billion.
B) $40 billion.
C) $35 billion.
D) $95 billion.
Correct Answer:

Verified
Correct Answer:
Verified
Q56: If households view a tax cut as
Q90: Scenario 34-2.The following facts apply to a
Q91: To reduce the effects of crowding out
Q92: Assume the MPC is 0.72.The multiplier is<br>A)4.53.<br>B)1.39.<br>C)2.57.<br>D)3.57.
Q94: Permanent tax cuts shift the AD curve<br>A)farther
Q96: A reduction in personal income taxes increases
Q97: The government buys new weapons systems.The manufacturers
Q98: If the multiplier is 6,then the MPC
Q99: In 2009 President Obama and Congress increased
Q100: Assume the MPC is 0.65.Assuming only the