Multiple Choice
Figure 34-2
(a) The Money Market
(b) The Aggregate Demand Curve 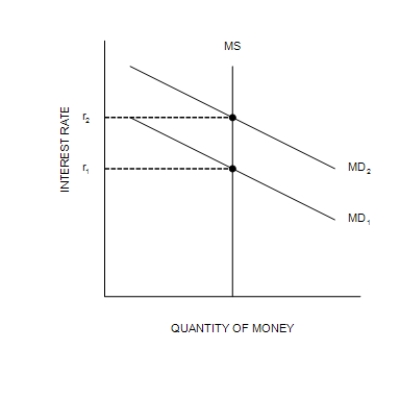
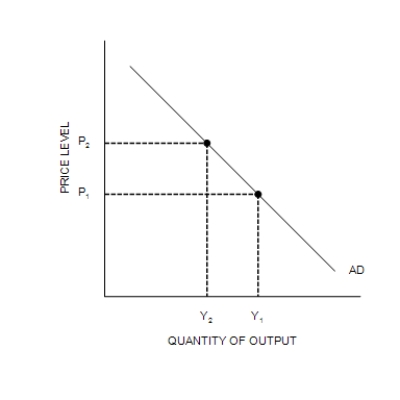
-Refer to Figure 34-2. A decrease in Y from Y1 to Y2 is explained as follows:
A) The Federal Reserve increases the money supply, causing the money-demand curve to shift from MD1 to MD2; this shift of MD causes r to increase from r1 to r2; and this increase in r causes Y to decrease from Y1 to Y2.
B) An increase in P from P1 to P2 causes the money-demand curve to shift from MD1 to MD2; this shift of MD causes r to increase from r1 to r2; and this increase in r causes Y to decrease from Y1 to Y2.
C) A decrease in P from P2 to P1 causes the money-demand curve to shift from MD1 to MD2; this shift of MD causes r to increase from r1 to r2; and this increase in r causes Y to decrease from Y1 to Y2.
D) An increase in the price level causes the money-demand curve to shift from MD2 to MD1; this shift of MD causes r to decrease from r2 to r1; and this decrease in r causes Y to decrease from Y1 to Y2.
Correct Answer:

Verified
Correct Answer:
Verified
Q131: Government expenditures on capital goods such as
Q132: The Employment Act of 1946 states that<br>A)the
Q133: Figure 34-4 <img src="https://d2lvgg3v3hfg70.cloudfront.net/TB7555/.jpg" alt="Figure 34-4
Q134: Suppose there is a tax decrease. To
Q135: Both the multiplier effect and the investment
Q137: The crowding-out effect occurs because an increase
Q138: Figure 34-9 <img src="https://d2lvgg3v3hfg70.cloudfront.net/TB7555/.jpg" alt="Figure 34-9
Q139: If the marginal propensity to consume is
Q140: According to the liquidity preference theory, an
Q141: When the Fed increases the money supply,