Multiple Choice
Figure 34-3. 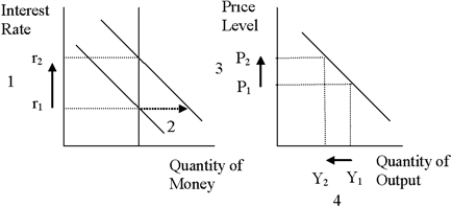
-Refer to Figure 34-3.What quantity is represented by the downward-sloping line on the left-hand graph?
A) the supply of money
B) the demand for money
C) the rate of inflation
D) Aggregate Demand.
Correct Answer:

Verified
Correct Answer:
Verified
Q43: According to liquidity preference theory,if the quantity
Q44: According to liquidity preference theory,if the price
Q45: According to the theory of liquidity preference,<br>A)if
Q46: According to liquidity preference theory,the opportunity cost
Q47: If the stock market crashes,then<br>A)aggregate demand increases,which
Q49: In the short run,an increase in the
Q50: If the stock market booms,then<br>A)aggregate demand increases,which
Q51: "Monetary policy can be described either in
Q52: In response to the sharp decline in
Q53: According to liquidity preference theory,an increase in