Multiple Choice
Figure 32-5
Refer to this diagram of the open-economy macroeconomic model to answer the questions below. 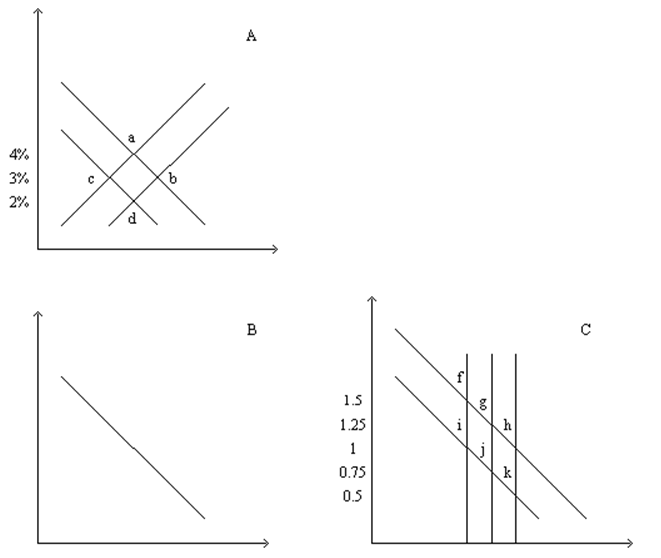
-Refer to Figure 32-5.Starting from 3% and .75,an increase in the government budget deficit can be illustrated as a move to
A) 4% and 1
B) 4% and .5
C) 2% and 1
D) 2% and .5
Correct Answer:

Verified
Correct Answer:
Verified
Q64: Figure 32-5<br>Refer to this diagram of the
Q65: In which case(s)does(do)a country's supply of loanable
Q66: In 1995 House Speaker Newt Gingrich threatened
Q67: When a country imposes an import quota,its<br>A)imports
Q68: When a country imposes an import quota,its<br>A)net
Q70: If the Canadian government raises it budget
Q71: When a country experiences capital flight its<br>A)net
Q72: If the government of a country with
Q73: If government policy encouraged households to save
Q74: If a government increases its budget deficit,then