Multiple Choice
Figure 30-2.On the graph,MS represents the money supply and MD represents money demand.The usual quantities are measured along the axes. 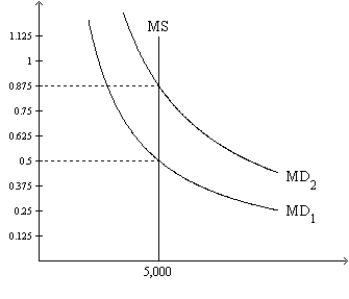
-Refer to Figure 30-2.If the relevant money-demand curve is the one labeled MD1,then the equilibrium value of money is
A) 0.5 and the equilibrium price level is 2.
B) 2 and the equilibrium price level is 0.5.
C) 0.5 and the equilibrium price level cannot be determined from the graph.
D) 2 and the equilibrium price level cannot be determined from the graph.
Correct Answer:

Verified
Correct Answer:
Verified
Q91: Suppose that monetary neutrality and the Fisher
Q120: Based on the quantity equation,if Y =
Q121: When the money market is drawn with
Q122: When the money market is drawn with
Q123: When the money market is drawn with
Q126: The Fisher effect<br>A)says the government can generate
Q127: When the price level falls,the number of
Q128: On a given morning,Franco sold 40 pairs
Q129: When the money market is drawn with
Q130: When inflation rises people will<br>A)demand more money