Multiple Choice
Figure 30-2.On the graph,MS represents the money supply and MD represents money demand.The usual quantities are measured along the axes. 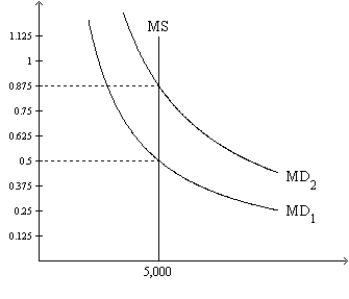
-Refer to Figure 30-2.Which of the following events could explain a shift of the money-demand curve from MD1 to MD2?
A) an increase in the value of money
B) a decrease in the price level
C) an open-market purchase of bonds by the Federal Reserve
D) None of the above is correct.
Correct Answer:

Verified
Correct Answer:
Verified
Q152: The velocity of money is<br>A)the rate at
Q176: Last year, you earned a nominal wage
Q197: From the early 1980's through the 1990's,the
Q198: When the money market is drawn with
Q199: According to the classical dichotomy,which of the
Q201: Suppose ice cream cones costs $3.Molly holds
Q203: If P = 2 and Y =
Q205: According to the classical dichotomy,which of the
Q206: Other things the same,an increase in velocity
Q207: According to the principle of monetary neutrality,a