Multiple Choice
Figure 30-2.On the graph,MS represents the money supply and MD represents money demand.The usual quantities are measured along the axes. 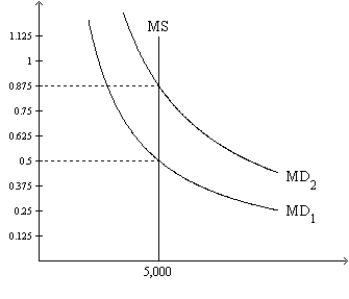
-Refer to Figure 30-2.Suppose the relevant money-demand curve is the one labeled MD1;also suppose the economy's real GDP is 20,000 for the year.If the money market is in equilibrium,then how many times per year is the typical dollar bill used to pay for a newly produced good or service?
A) 4
B) 2
C) 8
D) 10
Correct Answer:

Verified
Correct Answer:
Verified
Q25: Changes in nominal variables are determined mostly
Q44: The quantity theory of money<br>A)is a fairly
Q45: When the money market is drawn with
Q46: The classical dichotomy argues that changes in
Q47: If velocity = 5,the price level =
Q48: If the nominal interest rate is 15
Q51: In the long run,money demand and money
Q52: The nominal interest rate is 6 percent
Q53: The source of hyperinflations is primarily<br>A)lower output
Q54: If real output in an economy is