Multiple Choice
Figure 30-2.On the graph,MS represents the money supply and MD represents money demand.The usual quantities are measured along the axes. 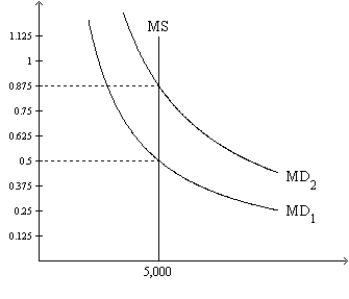
-Refer to Figure 30-2.At the end of 2009 the relevant money-demand curve was the one labeled MD2.At the end of 2010 the relevant money-demand curve was the one labeled MD1.Assuming the economy is always in equilibrium,what was the economy's approximate inflation rate for 2010?
A) -43 percent
B) -57 percent
C) 57 percent
D) 75 percent
Correct Answer:

Verified
Correct Answer:
Verified
Q131: According to the classical dichotomy,which of the
Q132: When the money market is drawn with
Q134: A decrease in the money supply creates
Q135: When the price level rises,the number of
Q137: Suppose monetary neutrality holds and velocity is
Q138: The classical theory of inflation<br>A)is also known
Q139: When the money market is drawn with
Q140: Under the assumptions of the Fisher effect
Q141: As the Consumer Price Index increases,the value
Q192: In the 1970s, in response to recessions