Multiple Choice
Figure 30-3.On the graph,MS represents the money supply and MD represents money demand.The usual quantities are measured along the axes. 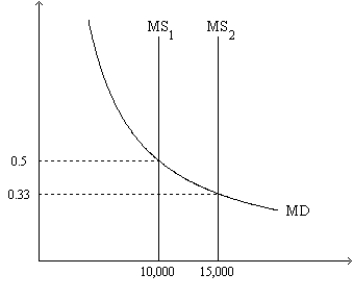
-Refer to Figure 30-3.Which of the following events could explain a shift of the money-supply curve from MS1 to MS2?
A) an increase in the value of money
B) a decrease in the price level
C) an open-market purchase of bonds by the Federal Reserve
D) the Federal Reserve sells bonds.
Correct Answer:

Verified
Correct Answer:
Verified
Q31: If M = 6,000,P = 3,and Y
Q32: When the money market is drawn with
Q33: In 2010 the U.S.government was running a
Q35: If V and M are constant and
Q37: If velocity and output were nearly constant,then<br>A)the
Q38: When the money market is drawn with
Q39: Suppose over some period of time the
Q41: Consider the money market drawn with the
Q76: Most economists believe the principle of monetary
Q121: When the money market is drawn with