Multiple Choice
Figure 30-3.On the graph,MS represents the money supply and MD represents money demand.The usual quantities are measured along the axes. 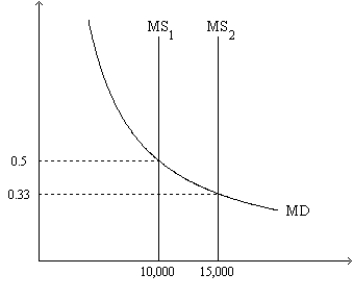
-Refer to Figure 30-3.At the end of 2009 the relevant money-supply curve was the one labeled MS1.At the end of 2010 the relevant money-supply curve was the one labeled MS2.Assuming the economy is always in equilibrium,what was the economy's approximate inflation rate for 2010?
A) -33 percent
B) 17 percent
C) 50 percent
D) 67 percent
Correct Answer:

Verified
Correct Answer:
Verified
Q14: The supply of money increases when<br>A)the price
Q180: When the money market is drawn with
Q182: According to monetary neutrality and the Fisher
Q183: The nominal interest rate is 5 percent
Q184: Suppose the money supply tripled,but at the
Q185: Your boss gives you an increase in
Q186: When the money market is drawn with
Q188: Your spouse complains that her 6% raise
Q189: When the money market is drawn with
Q190: According to the assumptions of the quantity