Multiple Choice
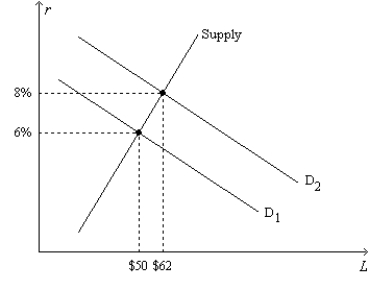
Figure 26-4.On the horizontal axis of the graph,L represents the quantity of loanable funds in billions of dollars. 
-Refer to Figure 26-4.The position and/or slope of the Supply curve are influenced by
A) the level of public saving.
B) the level of national saving.
C) decisions made by people who have extra income they want to save and lend out.
D) All of the above are correct.
Correct Answer:

Verified
Correct Answer:
Verified
Q54: What happens to desired investment spending if
Q110: The first three elements of a financial
Q111: Crowding out occurs when investment declines because<br>A)a
Q113: Which of the following counts as part
Q115: Other things the same,an increase in taxes
Q117: If the government instituted an investment tax
Q118: In the loanable funds model,an increase in
Q119: For an imaginary economy,when the real interest
Q153: A restaurant chain announces declining revenues. What's
Q171: If the government budget deficit increases, which