Multiple Choice
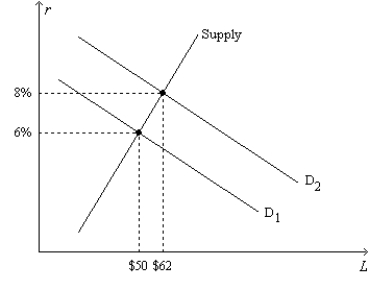
Figure 26-4.On the horizontal axis of the graph,L represents the quantity of loanable funds in billions of dollars. 
-Refer to Figure 26-4.Regard the position of the Supply curve as fixed,as on the graph.If the real interest rate is 8 percent,the inflation rate is 3 percent,and the market for loanable funds is in equilibrium,then the position of the demand-for-loanable-funds curve must be
A) D1 .
B) D2.
C) between D1 and D2.
D) to the right of D2.
Correct Answer:

Verified
Correct Answer:
Verified
Q35: Suppose government expenditures on goods and services
Q36: If Congress increased the tax rate on
Q37: Other things the same,an increase in the
Q38: If the demand for loanable funds shifts
Q39: The final element of a financial crisis
Q42: We interpret the meaning of "loanable funds"
Q43: Suppose the government ran a budget surplus
Q45: Suppose the U.S.offered a tax credit for
Q143: When tax code changes reduce saving incentives,
Q345: What is a mutual fund?