Multiple Choice
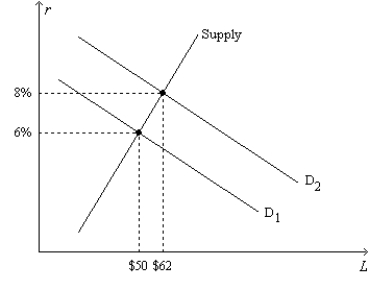
Figure 26-4.On the horizontal axis of the graph,L represents the quantity of loanable funds in billions of dollars. 
-Refer to Figure 26-4.Regard the position of the Supply curve as fixed,as on the graph.If the real interest rate is 4 percent,the inflation rate is 2 percent,and the market for loanable funds is in equilibrium,then the position of the demand-for-loanable-funds curve must be
A) D1 .
B) D2 .
C) between D1 and D2 .
D) to the left of D1.
Correct Answer:

Verified
Correct Answer:
Verified
Q47: According to the loanable funds model,which of
Q48: Which of the following statements is correct?<br>A)As
Q49: Which of the following could explain an
Q51: Figure 26-4.On the horizontal axis of the
Q53: Suppose the market for loanable funds is
Q54: The Eye of Horus incense company has
Q55: In 2009,the U.S.government's budget deficit increased substantially.Other
Q56: The ratio of debt to GDP in
Q57: Kroger's grocery chain wants to finance the
Q78: If there is shortage of loanable funds,