Multiple Choice
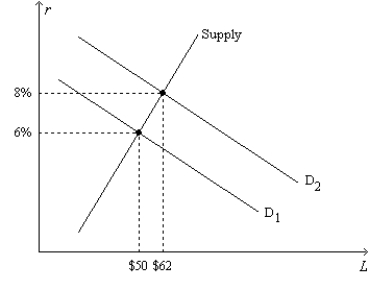
Figure 26-4.On the horizontal axis of the graph,L represents the quantity of loanable funds in billions of dollars. 
-Refer to Figure 26-4.If the equilibrium quantity of loanable funds is $50 billion and if the equilibrium nominal interest rate is 8 percent,then
A) there is an excess supply of loanable funds at a real interest rate of 6 percent.
B) there is an excess demand for loanable funds at a real interest rate of 8 percent.
C) the rate of inflation is approximately 2 percent.
D) the rate of inflation is approximately 14 percent.
Correct Answer:

Verified
Correct Answer:
Verified
Q14: What variable adjusts to balance demand and
Q73: If there is a shortage of loanable
Q75: Which of the following would necessarily create
Q76: If the quantity of loanable funds supplied
Q78: What would happen in the market for
Q79: Suppose a country has a consumption tax
Q80: If there is a surplus of loanable
Q167: National saving is the sum of _
Q177: Congress and the President implement an investment
Q178: Bonds issued by state and local governments