Multiple Choice
Figure 25-1.On the horizontal axis,K/L represents capital (K) per worker (L) .On the vertical axis,Y/L represents output (Y) per worker (L) . 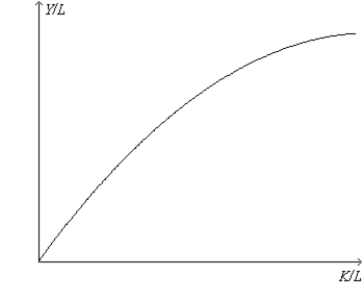
-Refer to Figure 25-1.The shape of the curve is consistent with which of the following statements about the economy to which the curve applies?
A) In the long run,a higher saving rate leads to a higher level of productivity.
B) In the long run,a higher saving rate leads to a higher level of income.
C) In the long run,a higher saving rate leads to neither a higher growth rate of productivity nor a higher growth rate of income.
D) All of the above are correct.
Correct Answer:

Verified
Correct Answer:
Verified
Q1: Assuming diminishing returns,<br>A)the increase in output growth
Q3: Other things the same,higher population growth<br>A)raises the
Q4: Country A and country B both increase
Q5: Foreign saving is used for domestic investment
Q6: All else equal,which of the following would
Q7: Government corruption<br>A)impedes the coordinating power of markets
Q8: Suppose that an American opens and operates
Q10: All else equal,if there are diminishing returns,then
Q11: Other things the same,if a country raises
Q131: Other things the same, a country that