Multiple Choice
Figure 2-17 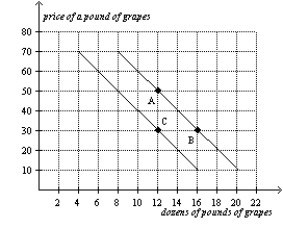
-Refer to Figure 2-17.The curves shown are
A) supply curves.
B) demand curves.
C) preference curves.
D) income-consumption curves.
Correct Answer:

Verified
Correct Answer:
Verified
Related Questions
Q23: A demand curve shows the relationship between
Q24: To display information on two variables,an economist
Q25: A relatively flat demand curve indicates that<br>A)quantity
Q26: The slope of a line that passes
Q27: Which of the following is correct?<br>A)A horizontal
Q29: Which of the following allows you to
Q30: Which of the following is not correct?<br>A)When
Q32: Figure 2-16 <img src="https://d2lvgg3v3hfg70.cloudfront.net/TB2297/.jpg" alt="Figure 2-16
Q33: In the ordered pair (20,30),20 is the<br>A)the
Q163: When a relevant variable that is not