Multiple Choice
Figure 2-20
Relationship Between Years of Education and Annual Income 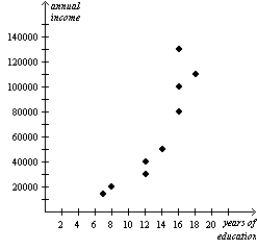
-Refer to Figure 2-20.According to the graph,the correlation between years of education and annual income is
A) positive
B) negative
C) inverse
D) normative
Correct Answer:

Verified
Correct Answer:
Verified
Related Questions
Q17: Figure 2-20<br>Relationship Between Years of Education and
Q18: The slope of a fairly flat upward-sloping
Q19: Graphs such as bar graphs and pie
Q20: The slope of a line passing through
Q21: The slope of a line that passes
Q23: A demand curve shows the relationship between
Q24: To display information on two variables,an economist
Q25: A relatively flat demand curve indicates that<br>A)quantity
Q26: The slope of a line that passes
Q27: Which of the following is correct?<br>A)A horizontal