Multiple Choice
An education researcher measured the IQ test scores of 78 seventh-grade students in a rural school, and also their school grade point average (GPA) measured on a 12-point scale. Here is a graph of GPA versus IQ for these students: 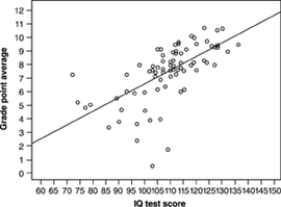 The name for this kind of graph is a
A) histogram.
B) bivariate plot.
C) boxplot.
D) scatterplot.
Correct Answer:

Verified
Correct Answer:
Verified
Q41: A random sample of statistics students was
Q42: Correlation is a measure of<br>A) center.<br>B) spread.<br>C)
Q43: The correlation between the foot lengths of
Q44: Here are the heights of a young
Q45: A study of home heating costs collects
Q47: A psychologist says that the correlation between
Q48: Tall men tend to marry women who
Q49: There is a strong straight-line relationship between
Q50: A random sample of statistics students was
Q51: For the data<br><img src="https://d2lvgg3v3hfg70.cloudfront.net/TB5066/.jpg" alt="For the data