Multiple Choice
A random sample of statistics students was selected. The heights (inches) and the weights (pounds) of the students were collected and are displayed in the figure below. 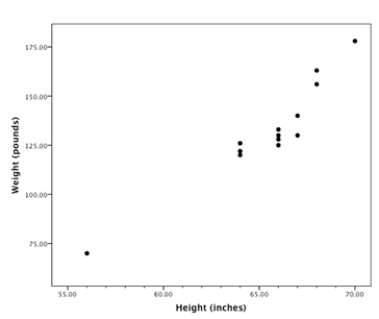 There is a student whose measurements were outliers in the data set. The height of this student was about
A) 56.
B) 65.
C) 70.
D) 73.
E) 178.
Correct Answer:

Verified
Correct Answer:
Verified
Q26: Consider the following data:<br><img src="https://d2lvgg3v3hfg70.cloudfront.net/TB5066/.jpg" alt="Consider the
Q27: An analyst gathers data on the number
Q28: Which of the following are most likely
Q29: The correlation between two variables is of
Q30: Which correlation indicates almost no straight-line relationship?<br>A)
Q32: How well does the number of beers
Q33: A study found that the size of
Q34: To display the relationship between per capita
Q35: A nutrition study measured how many helpings
Q36: You calculate the correlation between height and