menu-iconExamlexExamLexServices

Discover

Ask a Question
  1. All Topics
  2. Topic
    Statistics
  3. Study Set
    Basic Business Statistics Study Set 2
  4. Exam
    Exam 2: Presenting Data in Tables and Charts
  5. Question
    Given Below Is the Scatter Plot of the Market Value
Solved

Given Below Is the Scatter Plot of the Market Value

Question 131

Question 131

True/False

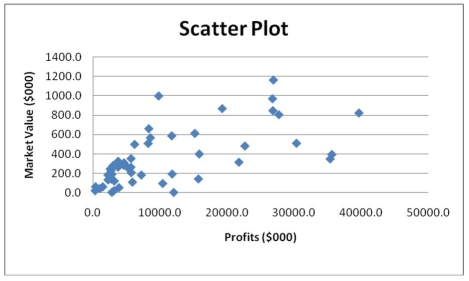
Given below is the scatter plot of the market value (thousands$)and profit (thousands$)of 50 Australian companies.Higher market values appear to be associated with higher profits.

Correct Answer:

verifed

Verified

Unlock this answer now
Get Access to more Verified Answers free of charge

Related Questions

Q13: Apple Computer, Inc. collected information on the

Q31: If the values of the seventh and

Q32: Instruction 2.1<br>An insurance company evaluates many

Q98: A polygon can be constructed from a

Q118: A histogram can have gaps between the

Q127: Instruction 2-7<br>The Stem-and-Leaf display below contains

Q132: Instruction 2-11<br>The table below contains the

Q134: Instruction 2-4<br>A survey was conducted to

Q135: Instruction 2-16<br>Given below is the stem-and-leaf

Q157: In a survey,150 executives were asked what

Examlex

ExamLex

About UsContact UsPerks CenterHomeschoolingTest Prep

Work With Us

Campus RepresentativeInfluencers

Links

FaqPricingChrome Extension

Download The App

Get App StoreGet Google Play

Policies

Privacy PolicyTerms of ServiceHonor CodeCommunity Guidelines

Scan To Download

qr-code

Copyright © (2025) ExamLex LLC.

Privacy PolicyTerms Of ServiceHonor CodeCommunity Guidelines