menu-iconExamlexExamLexServices

Discover

Ask a Question
  1. All Topics
  2. Topic
    Statistics
  3. Study Set
    Basic Business Statistics Study Set 2
  4. Exam
    Exam 2: Presenting Data in Tables and Charts
  5. Question
    Given Below Is the Scatter Plot of the Number of Employees
Solved

Given Below Is the Scatter Plot of the Number of Employees

Question 14

Question 14

True/False

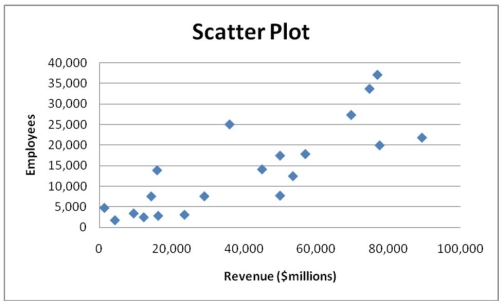
Given below is the scatter plot of the number of employees and the total revenue ($millions)of 20 companies from New Zealand.There appears to be a positive relationship between total revenue and the number of employees.

Correct Answer:

verifed

Verified

Unlock this answer now
Get Access to more Verified Answers free of charge

Related Questions

Q9: Instruction 2-9<br>The frequency distribution below represents

Q10: Instruction 2-17<br>The table below contains the

Q12: Instruction 2-11<br>The table below contains the

Q13: Instruction 2-17<br>The table below contains the

Q15: Instruction 2-7<br>The Stem-and-Leaf display below contains

Q16: Instruction 2-9<br>The frequency distribution below represents

Q17: Instruction 2-17<br>The table below contains the

Q18: Instruction 2-11<br>The table below contains the

Q19: Instruction 2-15<br>The table below contains the

Q161: A side-by-side chart is two histograms plotted

Examlex

ExamLex

About UsContact UsPerks CenterHomeschoolingTest Prep

Work With Us

Campus RepresentativeInfluencers

Links

FaqPricingChrome Extension

Download The App

Get App StoreGet Google Play

Policies

Privacy PolicyTerms of ServiceHonor CodeCommunity Guidelines

Scan To Download

qr-code

Copyright © (2025) ExamLex LLC.

Privacy PolicyTerms Of ServiceHonor CodeCommunity Guidelines