Multiple Choice
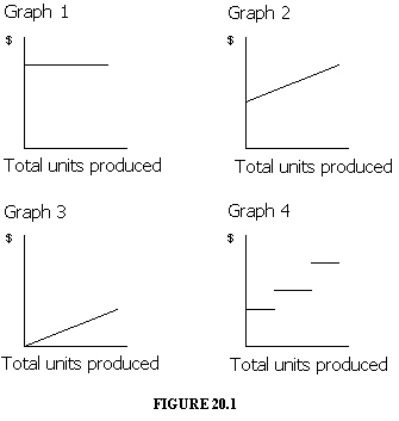 Which of the graphs in Figure 20-1 illustrates the behavior of a total fixed cost?
A) Graph 2
B) Graph 3
C) Graph 4
D) Graph 1
Correct Answer:

Verified
Correct Answer:
Verified
Related Questions
Q31: If employees accept a wage contract that
Q99: For the coming year, River Company estimates
Q141: Unit variable cost does not change as
Q153: Total fixed costs change as the level
Q160: Which of the following is not an
Q167: Penny Company sells 25,000 units at $59
Q168: If fixed costs are $46,800, the unit
Q169: Harold Corporation just started business in January
Q173: As production increases, what should happen to
Q173: The graph of a variable cost when