Multiple Choice
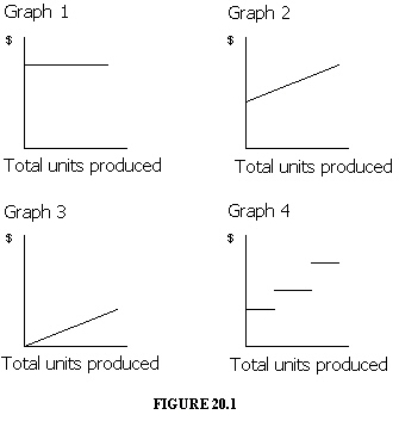 Which of the graphs in Figure 20-1 illustrates the behavior of a total variable cost?
A) Graph 2
B) Graph 3
C) Graph 4
D) Graph 1
Correct Answer:

Verified
Correct Answer:
Verified
Related Questions
Q16: If fixed costs are $850,000 and variable
Q158: If sales total $2,000,000, fixed costs total
Q202: If fixed costs are $490,000, the unit
Q203: For purposes of analysis, mixed costs are
Q205: With the aid of computer software, managers
Q206: The manufacturing cost of Prancer Industries for
Q209: Currently, the unit selling price is $50,
Q210: Kissimmee Paint Co. reported the following data
Q211: Rental charges of $40,000 per year plus
Q212: As production increases, what would you expect