Multiple Choice
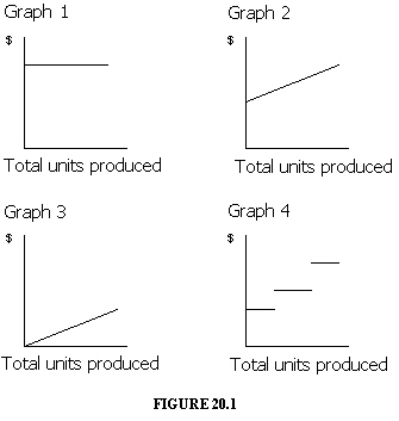 Which of the graphs in Figure 20-1 illustrates the nature of a mixed cost?
A) Graph 2
B) Graph 3
C) Graph 4
D) Graph 1
Correct Answer:

Verified
Correct Answer:
Verified
Related Questions
Q4: Direct materials cost that varies with the
Q57: The adoption of variable costing for managerial
Q104: If the unit selling price is $40,
Q183: Garmo Co. has an operating leverage of
Q184: A mixed cost has characteristics of both
Q185: Carter Co. sells two products, Arks and
Q187: Harold Corporation just started business in January
Q191: Marcye Co. manufactures office furniture. During the
Q193: Mia Enterprises sells a product for $90
Q212: If fixed costs are $500,000 and the