Essay
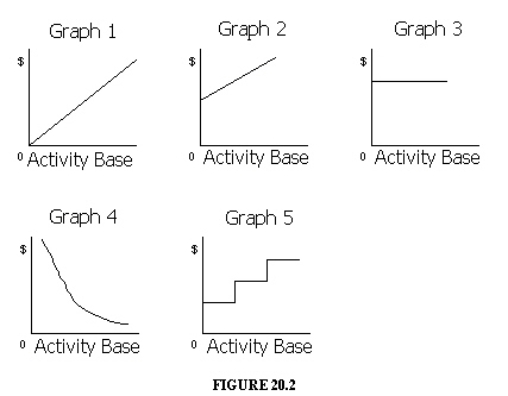
The cost graphs in the illustration below shows various types of cost behaviors.
For each of the following costs, identify the cost graph that best describes its cost behavior as the number of units produced and sold increases:

Correct Answer:

Verified
Correct Answer:
Verified
Related Questions
Q1: A firm operated at 80% of capacity
Q2: Carter Co. sells two products, Arks and
Q3: Which of the following conditions would cause
Q4: If sales are $820,000, variable costs are
Q7: Trail Bikes, Inc. sells three Deluxe bikes
Q9: If sales are $914,000, variable costs are
Q19: Only a single line, which represents the
Q37: If a business sells two products, it
Q82: Break-even analysis is one type of cost-volume-profit
Q195: If fixed costs are $650,000 and the