Multiple Choice
Use the following to answer questions
Figure: Aggregate Demand 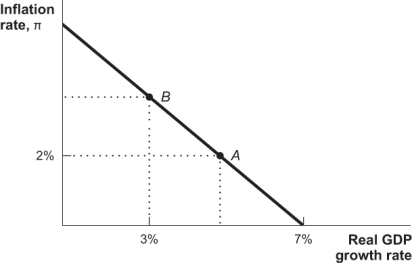
-(Figure: Aggregate Demand) Point B on this aggregate demand curve represents an inflation rate of:
A) 3%.
B) 4%.
C) 5%.
D) 7%.
Correct Answer:

Verified
Correct Answer:
Verified
Related Questions
Q218: The short-run aggregate supply curve shows that
Q219: An increase in the money supply is
Q220: Which of the following is NOT a
Q221: An increase in spending growth will cause
Q222: In the equation <span class="ql-formula"
Q224: The long-run aggregate supply curve has a
Q225: An unexpected increase in money growth increases
Q226: Which of the following is NOT an
Q227: An increase in expected inflation will cause
Q228: The primary purpose of the AD-AS model