Multiple Choice
Use the following to answer questions
Figure: Aggregate Demand 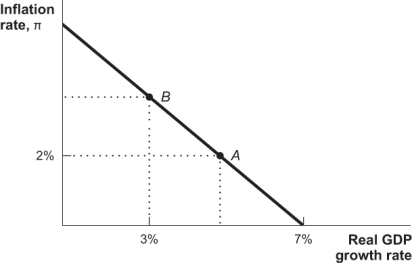
-(Figure: Three Aggregate Demand Curves) Figure: Three Aggregate Demand Curves 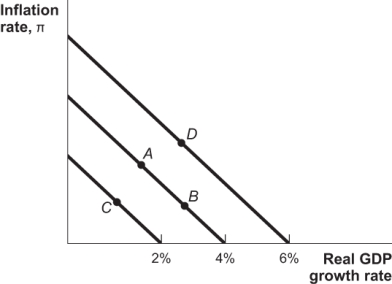 Consider the three aggregate demand curves shown in the graph.Movement from Point A to Point D represents:
A) an increase in spending growth from 2% to 3%.
B) an increase in spending growth from 4% to 6%.
C) an increase in real GDP growth,but not spending growth.
D) an increase in inflation,but not spending growth.
Correct Answer:

Verified
Correct Answer:
Verified
Q177: An increase in spending growth causes a
Q178: The long-run aggregate supply curve is:<br>A) upward
Q179: A temporary decrease in aggregate demand:<br>A) raises
Q180: In the AD-AS model with a long-run
Q181: Productivity shocks were the primary cause of
Q183: The Smoot-Hawley Tariff of 1930 raised tariff
Q184: In the graph of the AD-AS model,what
Q185: The Great Depression would have been a
Q186: The "Solow" growth rate is the rate
Q187: The aggregate demand curve indicates that at