Multiple Choice
Use the following to answer questions :
Figure: Harold's Indifference Curves
The figure shows three of Harold's indifference curves for bread and cheese. 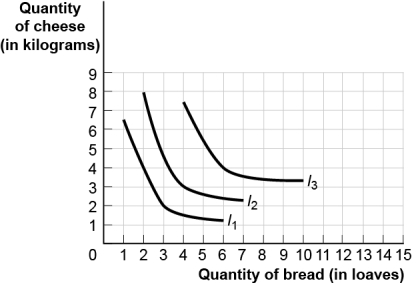
-(Figure: Harold's Indifference Curves) Use Figure Harold's Indifference Curves.Given that the price of bread is $1 per loaf and the price of cheese is $2 per kilogram,as Harold's income increases from $10 to $14,we can determine that bread is a(n) _____ good and cheese is a(n) _____ good.
A) inferior;inferior
B) normal;inferior
C) inferior;normal
D) normal;normal
Correct Answer:

Verified
Correct Answer:
Verified
Q2: Use the following to answer questions :
Q6: Use the following to answer questions :<br>Figure:
Q8: Use the following to answer question: <img
Q9: Use the following to answer questions :<br>Figure:
Q20: Use the following to answer question: <img
Q27: Ellen consumes goods X and Y.As she
Q42: Diminishing marginal utility occurs with increasing total
Q90: The ratio of the prices of two
Q92: The slope of a(n)_ curve shows the
Q131: Decreases in the price of the good