Multiple Choice
Use the following to answer questions: 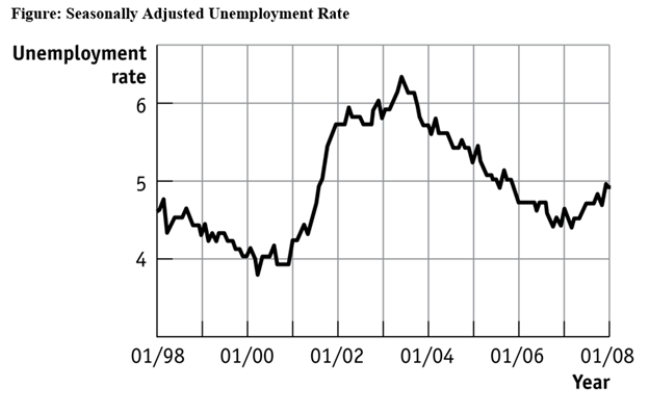
-(Figure: Seasonally Adjusted Unemployment Rate) Use Figure: Seasonally Adjusted Unemployment Rate.The distance between each labeled point on the horizontal axis is 1 year,and the distance between each labeled point on the vertical axis is 1 percentage point of unemployment.Unemployment was _____ between 1/2001 and 1/2003 and _____ between 1/2007 and 1/2008.
A) increasing;decreasing
B) increasing;increasing
C) decreasing;increasing
D) decreasing;decreasing
Correct Answer:

Verified
Correct Answer:
Verified
Q4: A pie chart is used to depict
Q5: If two variables are positively related,on a
Q18: Use the following to answer question: <img
Q20: Use the following to answer question 43:
Q31: Use the following to answer question: <img
Q36: Use the following to answer question: <img
Q37: The scaling of the axes of a
Q53: Use the following to answer question: <img
Q56: Taylor sees a bar graph showing the
Q59: In looking at a chart of the