Essay
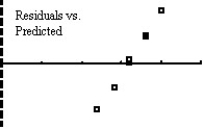
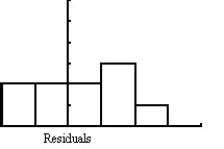
Ten students in a graduate program at the University of Toronto were randomly selected.Their grade point averages (GPAs)when they entered the program were between 3.5 and 4.0.The data consist of the students' GPAs on entering the program and their current GPAs.Several graphs are shown below. 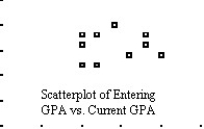
Correct Answer:

Verified
The scatterplot of the data does not sug...View Answer
Unlock this answer now
Get Access to more Verified Answers free of charge
Correct Answer:
Verified
View Answer
Unlock this answer now
Get Access to more Verified Answers free of charge
Q26: Ten students from a large lecture course
Q27: Applicants for a particular job,which involves
Q28: Ten students in a graduate program
Q29: Determine which plot shows the strongest linear
Q30: Applicants for a particular job,which involves
Q32: The index of exposure to radioactive
Q33: Determine which plot shows the strongest linear
Q34: The typing speeds (in words per
Q35: Applicants for a particular job,which involves
Q36: A grass seed company conducts a