Essay
Data collected from 20 students in Statistics classes included their heights (in inches)and weights (in pounds),and are displayed in the following scatterplot.Make a histogram of the weights of the children. 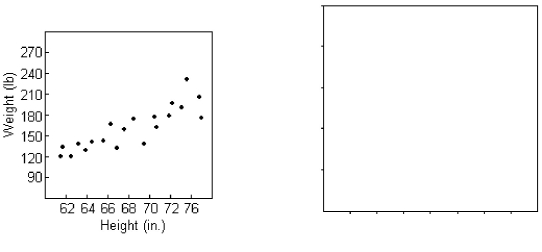
Correct Answer:

Verified
Correct Answer:
Verified
Related Questions
Q25: <img src="https://d2lvgg3v3hfg70.cloudfront.net/TB3450/.jpg" alt=" A)Moderately strong association
Q26: Fast food is often considered unhealthy
Q27: A study is conducted on the causes
Q28: Teacher: weekly salary,teacher: years of experience<br>A)Teacher: weekly
Q29: Owners of a small shop tracked
Q31: A shop owner tries to predict heater
Q32: The table contains the weights (in
Q33: The table shows the number of
Q34: A study was conducted to compare the
Q35: A researcher studies children in elementary school