Multiple Choice
The relationship between two quantities X and Y is examined,and the association is shown in the scatterplot below. 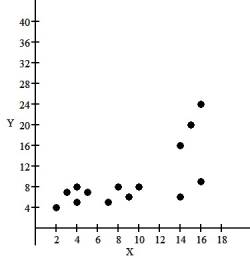 Should you re-express these data before trying to fit a model? Explain.
A) Data should be re-expressed.Scatterplot shows upward curvature and increasing scatter as X increases.
B) Data should be re-expressed.Scatterplot shows linear relationship and uniform scatter.
C) Data does not need to be re-expressed.Scatterplot shows upward curvature and increasing scatter as X increases.
D) Data should be re-expressed.Scatterplot shows linear relationship.
E) Data does not need to be re-expressed.Scatterplot shows linear relationship.
Correct Answer:

Verified
Correct Answer:
Verified
Q34: A study was conducted to compare the
Q35: A researcher studies children in elementary school
Q36: Oranges: weight (ounces),oranges: weight (grams)<br>A)Positive,linear,strong<br>B)Positive,nonlinear,moderate<br>C)Negative,linear,moderate<br>D)Negative,nonlinear,moderate<br>E)Positive,no form,strong
Q37: A survey was conducted in 20 counties
Q38: Oranges: weight (grams),oranges: weight (milligrams)<br>A)Oranges: weight (grams):
Q40: A survey was conducted in 26 counties
Q41: <img src="https://d2lvgg3v3hfg70.cloudfront.net/TB3450/.jpg" alt=" A)Linear association,moderately strong
Q42: The table contains the daily study
Q43: The paired data below consist of
Q44: Litres remaining in a tank of gas,kilometres