Multiple Choice
An English instructor gave a final exam and found a mean score of 70 points and a standard deviation of 6.8 points.Assume that a Normal model can be applied.Draw and label the Normal model for the exam scores.Describe the scores of the top 2.5%.
A) 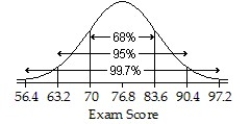 ; Higher than 90.4 points
B)  ; Higher than 76.8 points
C)  ; 83.6 points
D) 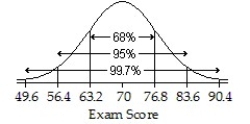 ; Higher than 83.6 points
E) 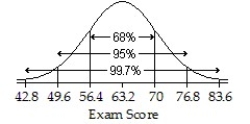 ; Higher than 76.8 points
Correct Answer:

Verified
Correct Answer:
Verified
Q29: A Normal Probability plot is a<br>A)Histogram.<br>B)Scatterplot.<br>C)Boxplot.<br>D)Stem-and-leaf plot.
Q30: The average amount of snowfall in a
Q31: z > 0.59<br>A)25.47%<br>B)72.24%<br>C)22.24%<br>D)27.76%<br>E)21.90%
Q32: Here are some summary statistics for
Q33: Here are some summary statistics for
Q35: μ = 0.38,20% above 0.50; σ =
Q36: The average attendance for your local hockey
Q37: The volumes of soda in 1 litre
Q38: Adam played golf on Saturday and
Q39: z > -1.82<br>A)3.44%<br>B)-3.44%<br>C)96.56%<br>D)46.56%<br>E)92.57%