Multiple Choice
Here is a histogram of the assets (in millions of dollars) of 71 companies.What aspect of this distribution makes it difficult to summarize,or to discuss,the centre and spread? What could be done with these data to make it easier to discuss the distribution? 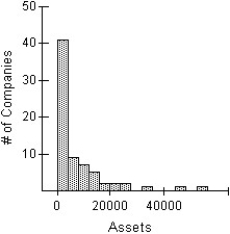
A) The distribution of assets of the 71 companies is heavily skewed to the right.The vast majority of the companies have assets represented in the first bar of the histogram,0 to 4000 dollars.This makes the discussion of the distribution meaningless.Re-expressing these data using logs or square roots might make the distribution nearly symmetric,and a meaningful discussion of centre and spread might be possible.
B) The distribution of assets of the 71 companies is heavily skewed to the left.The vast majority of the companies have assets represented in the first bar of the histogram,0 to 4 billion dollars.This makes the discussion of the distribution meaningless.Re-expressing these data using logs or square roots might make the distribution nearly symmetric,and a meaningful discussion of centre and spread might be possible.
C) The distribution of assets of the 71 companies is heavily skewed to the right.The vast majority of the companies have assets represented in the first bar of the histogram,0 to 4 billion dollars.This makes the discussion of the distribution meaningless.Re-expressing these data using logs or squares might make the distribution nearly symmetric,and a meaningful discussion of centre and spread might be possible.
D) The distribution of assets of the 71 companies is heavily skewed to the right.The vast majority of the companies have assets represented in the first bar of the histogram,0 to 4000 dollars.This makes the discussion of the distribution meaningless.Re-expressing these data using logs or squares might make the distribution nearly symmetric,and a meaningful discussion of centre and spread might be possible.
E) The distribution of assets of the 71 companies is heavily skewed to the right.The vast majority of the companies have assets represented in the first bar of the histogram,0 to 4 billion dollars.This makes the discussion of the distribution meaningless.Re-expressing these data using logs or square roots might make the distribution nearly symmetric,and a meaningful discussion of centre and spread might be possible.
Correct Answer:

Verified
Correct Answer:
Verified
Q36: Do men and women run a 5-kilometre
Q37: Here is a histogram of the assets
Q38: The boxplots display case prices (in dollars)of
Q39: Here is a histogram of the assets
Q40: The boxplots display case prices (in dollars)of
Q41: The weekly salaries (in dollars)of sixteen government
Q42: In a child psychology course,children took part
Q43: Match each class with the corresponding boxplot
Q44: Here is a histogram of the assets
Q46: Which class had the highest median score?<br>A)Class