Multiple Choice
Here is a histogram of the assets (in millions of dollars) of 71 companies. 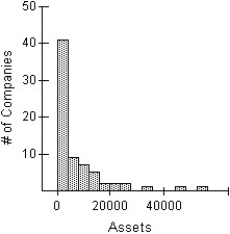 Which of the following is an appropriate re-expression of these data? (More than one may be appropriate.)
I 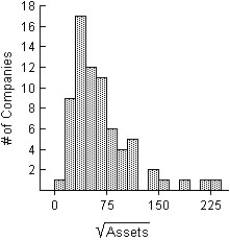
II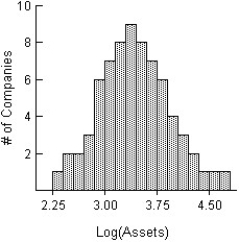
III 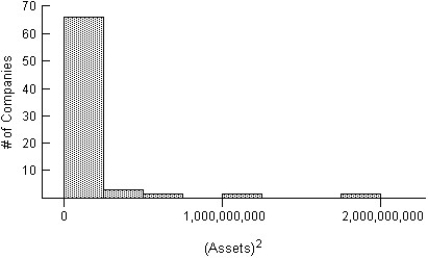
A) II
B) I,II
C) II,III
D) I
E) None of these are appropriate re-expression displays.
Correct Answer:

Verified
Correct Answer:
Verified
Q17: Which class had the largest standard deviation?<br>A)Class
Q18: The boxplots display case prices (in dollars)of
Q19: The back-to-back stem-and-leaf display compares the
Q20: The back-to-back stem-and-leaf display compares the
Q21: The weekly salaries (in dollars)of 24 randomly
Q23: The Ontario Ministry of Education collects data
Q24: For which class are the mean and
Q25: The test scores of 15 students are
Q26: For class 2,compare the mean and the
Q27: Which class had the smallest IQR?<br>A)Class 1,because