Multiple Choice
The histogram shows the cost of living,in dollars,in 32 Canadian towns. 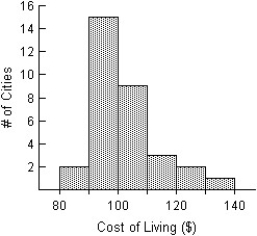
A) The distribution of the cost of living in the 32 Canadian cities is unimodal and skewed to the right.The distribution is centred around $100,and spread out,with values ranging from $80 to $139.99.
B) The distribution of the cost of living in the 32 Canadian cities is unimodal and skewed to the right.The distribution is centred around $110,and spread out,with values ranging from $80 to $140.
C) The distribution of the cost of living in the 32 Canadian cities is unimodal and skewed to the right.The distribution is centred around $90,and spread out,with values ranging from $80 to $139.99.
D) The distribution of the cost of living in the 32 Canadian cities is unimodal and skewed to the left.The distribution is centred around $100,and spread out,with values ranging from $80 to $139.99.
E) The distribution of the cost of living in the 32 Canadian cities is unimodal.The distribution is centred around $100,and spread out,with values ranging from $80 to $140.
Correct Answer:

Verified
Correct Answer:
Verified
Q118: Here are some summary statistics for
Q119: The weekly salaries,in dollars,of 16 government
Q120: The following stem-and-leaf display shows the
Q121: The data below give the number of
Q122: The ages of the 21 members
Q124: A small company employs a supervisor at
Q125: Here are the amounts,in dollars,spent by
Q126: The diastolic blood pressures,in mm Hg,for a
Q127: Here are the average mathematics achievement
Q128: Shown below are the boxplot and the