Multiple Choice
Shown below are the histogram and summary statistics for the reading scores of 29 fifth graders. 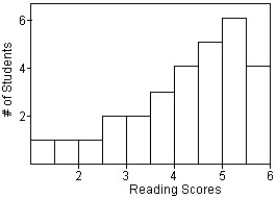 Which measures of centre and spread would you use for this distribution?
A) Mean and IQR,because the data is skewed to the left.
B) Median and standard deviation,because the data is skewed to the left.
C) Mean and standard deviation,because the data is skewed to the left.
D) Mean and standard deviation,because the data is symmetric.
E) Median and IQR,because the data is skewed to the left.
Correct Answer:

Verified
Correct Answer:
Verified
Q27: Here are the weekly winnings for several
Q28: Shown below are the boxplot and
Q29: The annual incomes,in dollars,of several doctors
Q30: The number of days off that 30
Q31: The weights,in kilograms,of the members of the
Q33: A consumer group surveyed the prices for
Q34: Here are some summary statistics for
Q35: Students were asked to make a
Q36: Here are some statistics for the
Q37: A small company employs a supervisor at