Multiple Choice
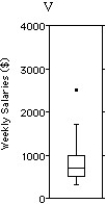
Shown below are the histogram and summary statistics for the weekly salaries (in dollars) of 24 randomly selected employees of a company: 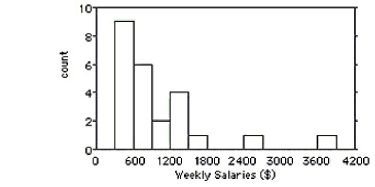 Choose the boxplot that represents the given data.
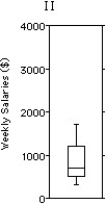
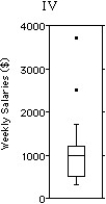
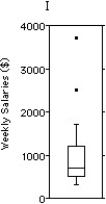

A) I
B) II
C) III
D) IV
E) V
Correct Answer:

Verified
Correct Answer:
Verified
Related Questions
Q137: Here are summary statistics for the
Q138: A clerk entering salary data into a
Q139: Here are summary statistics for the
Q140: Which set has the largest standard
Q141: Number of innings in the baseball games
Q143: Here are the average mathematics achievement
Q144: Here are some summary statistics for
Q145: A substitute teacher traveled the following distances,in
Q146: Here are the commutes (in kilometres)for a
Q147: A store manager kept track of