Solved
The Test Scores of 40 Students Are Listed Below Choose the Boxplot That Represents the Given Data
Multiple Choice
The test scores of 40 students are listed below. Choose the boxplot that represents the given data.
I 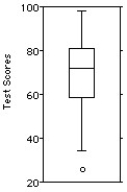
II 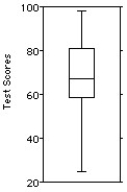
III 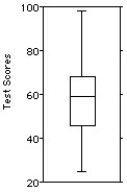
IV 
V 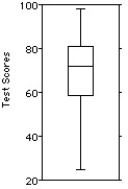
A) I
B) II
C) III
D) IV
E) V
Correct Answer:

Verified
Correct Answer:
Verified
Related Questions
Q33: A consumer group surveyed the prices for
Q34: Here are some summary statistics for
Q35: Students were asked to make a
Q36: Here are some statistics for the
Q37: A small company employs a supervisor at
Q39: The following data consists of the
Q40: Here are the average mathematics achievement
Q41: A particular student has a grade point
Q42: Here are some scores from a recent
Q43: Shown below are the data and