Multiple Choice
The weekly salaries (in dollars) of 24 randomly selected employees of a company are shown below.
Choose the boxplot that represents the given data.
I 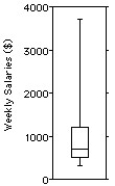
II 
III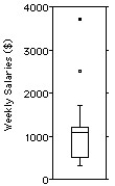
IV 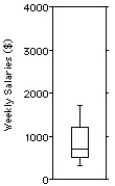
V 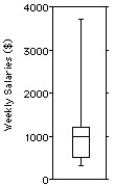
A) I
B) II
C) III
D) IV
E) V
Correct Answer:

Verified
Correct Answer:
Verified
Related Questions
Q47: The test scores of 19 students are
Q48: In a survey,26 voters were asked their
Q49: Here are the summary statistics for
Q50: In a survey,20 people were asked how
Q51: Here are the summary statistics for
Q53: Two sections of a class took the
Q54: Last year,nine employees of an electronics company
Q55: The weekly salaries (in dollars)of 24
Q56: Which set has the largest standard
Q57: Number of times each face of a