Multiple Choice
The focus of a recent survey was on teenagers' familiarity with and use of modern technology.The teenagers were asked if they used each of the following technologies on a daily basis and if the technology was critically important to own.For each question,the percentage of those responding "Yes" is given.Subtracting the "Use daily" percentage from the "Critically important to own" percentage gives the "Importance Gap".Here are the results: Which of the following displays is the most appropriate for these data?
I 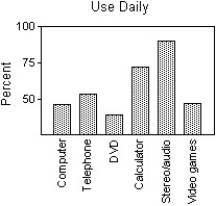
II 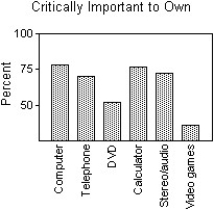
III 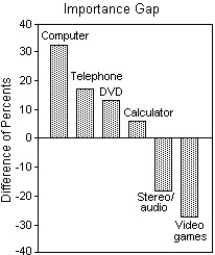
A) III
B) I
C) II
D) All of these displays are equally appropriate.
E) None of these displays are appropriate.
Correct Answer:

Verified
Correct Answer:
Verified
Q5: A newspaper surveyed its subscribers as
Q6: The Centers for Disease Control in
Q7: A company held a cholesterol screening
Q8: A survey of automobiles parked in
Q9: A survey of automobiles parked in
Q11: An article in a magazine examined
Q12: Students in a political science course
Q13: A survey of automobiles parked in
Q14: Students in a political science course
Q15: A survey of automobiles parked in